
Bitcoin Price Analysis
Bitcoin price extended its decline below the $30,500 support zone. A low was formed near the $29,250 zone before there was a recovery wave.
The price climbed above the $30,000 and $31,000 resistance levels. However, the price failed on a few occasions near the $31,500 and $31,550 levels. The recent high was formed near $31,549 before there was a fresh decline.
There is also a key bearish trend line forming with resistance near $31,200 on the 4-hours chart of the BTC/USD pair. To start another increase, the price must settle above the $31,550 level in the near term.
In the stated case, bitcoin could rise towards the $32,500 resistance or even $33,000. The next major resistance sits near the $34,500 level. If there is no upside break, the price might start a fresh decline below $30,000. The next key support is near the $29,250 level. Any more losses might call for a test of the $28,500 support zone.

Bitcoin Price
Looking at the chart, bitcoin price is clearly trading below $31,000 and the 55 simple moving average (4-hours). Overall, the price could start a steady increase if there is a move above the $32,000 level.
Ethereum Price Analysis
Earlier, ethereum struggled to clear the $2,000 resistance against the US Dollar. ETH price started a fresh decline below the $1,850 level and moved into a bearish zone.
The 50% Fib retracement level of the downward move from the $1,918 swing high to $1,725 low is also near the $1,820 zone. Besides, there is a key bearish trend line forming with resistance near $1,910 on the 4-hours chart.
A clear move above the $1,900 level might start a steady increase. The next key resistance is near the $2,000 zone, above which the price might accelerate higher towards the $2,250 level.
On the downside, an initial support is near the $1,725 level. The next major support is now near the $1,700 level. A break below the $1,700 support could push the price to $1,620. Any more losses could lead the price towards $1,550 or even $1,520.

Ethereum Price
Looking at the chart, Ethereum price is clearly trading below the $1,900 zone and the 55 simple moving average (4-hours). Overall, ether price could start a fresh decline if there is a clear move below the $1,700 level.
Chainlink Price Analysis
The one-day Chainlink price analysis shows LINK price is going on the bullish side as the LINK prices are approaching $8.46 after a successive bullish streak. For now, the buyers seem to be in control as they pushed the prices higher from $7.62 to $8.46. The current market conditions are in favor of the bulls as the RSI indicator is well above the 60 levels and is currently trading at 64.65. The MACD indicator is also in the bullish zone as the signal line is well above the histogram.

The moving averages are also indicating a bullish trend as the 50-day MA is well above the 200-day MA. The immediate support for the coin lies at $8.20 and $8.00. The resistance levels are at $9.00 and $9.20.The volatility is currently starting to increase, and the Bollinger bands’ values are currently starting to widen, and this is a sign that the prices may see some volatile price action in the near future.
Chainlink price analysis shows that the trend is in favor of the bulls as they pushed the prices higher from $7.62 to $8.46. The current market condition is expected to continue in the near future, and the prices may soon test the $9.00 resistance levels. However, the volatile price action cannot be ruled out as the Bollinger bands’ values are currently widening.
Avalanche Price Analysis
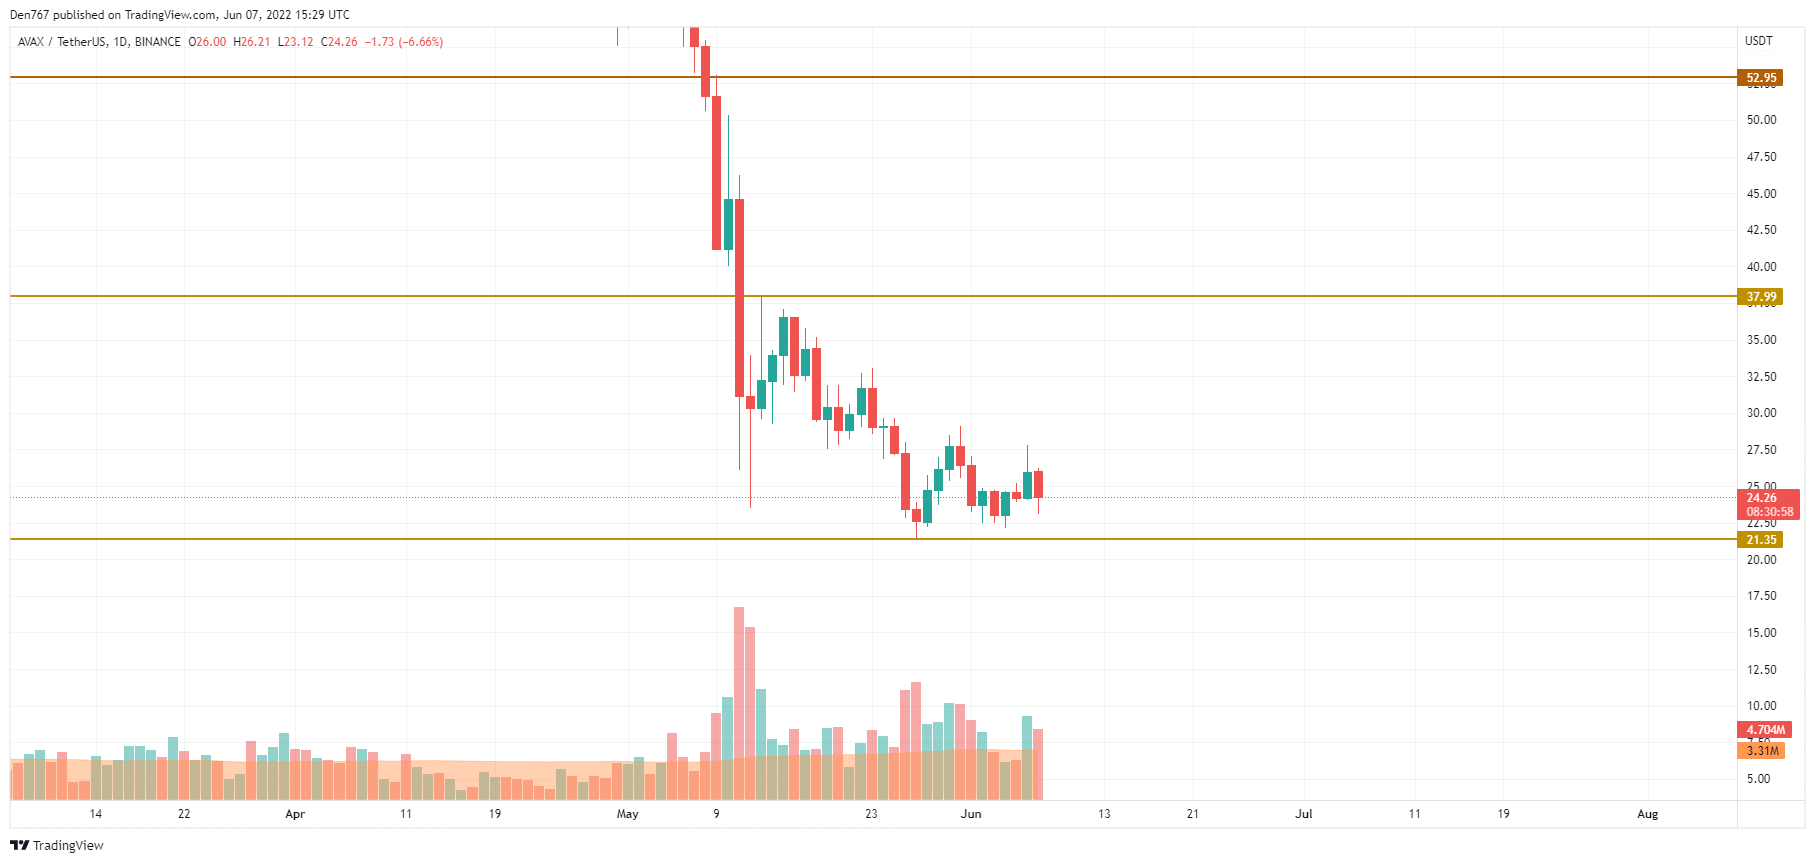
Avalanche (AVAX) is the biggest loser from the list today, going down by 8.13%.

Despite the drop, AVAX is looking better than Solana (SOL) as the price is not so close to the support zone. However, the volume has risen, which means that bears can maintain their pressure. If that happens and the daily candle fixes near the $20 mark, one can expect the fall to the $15-$17 zone shortly.
Solana Price Analysis
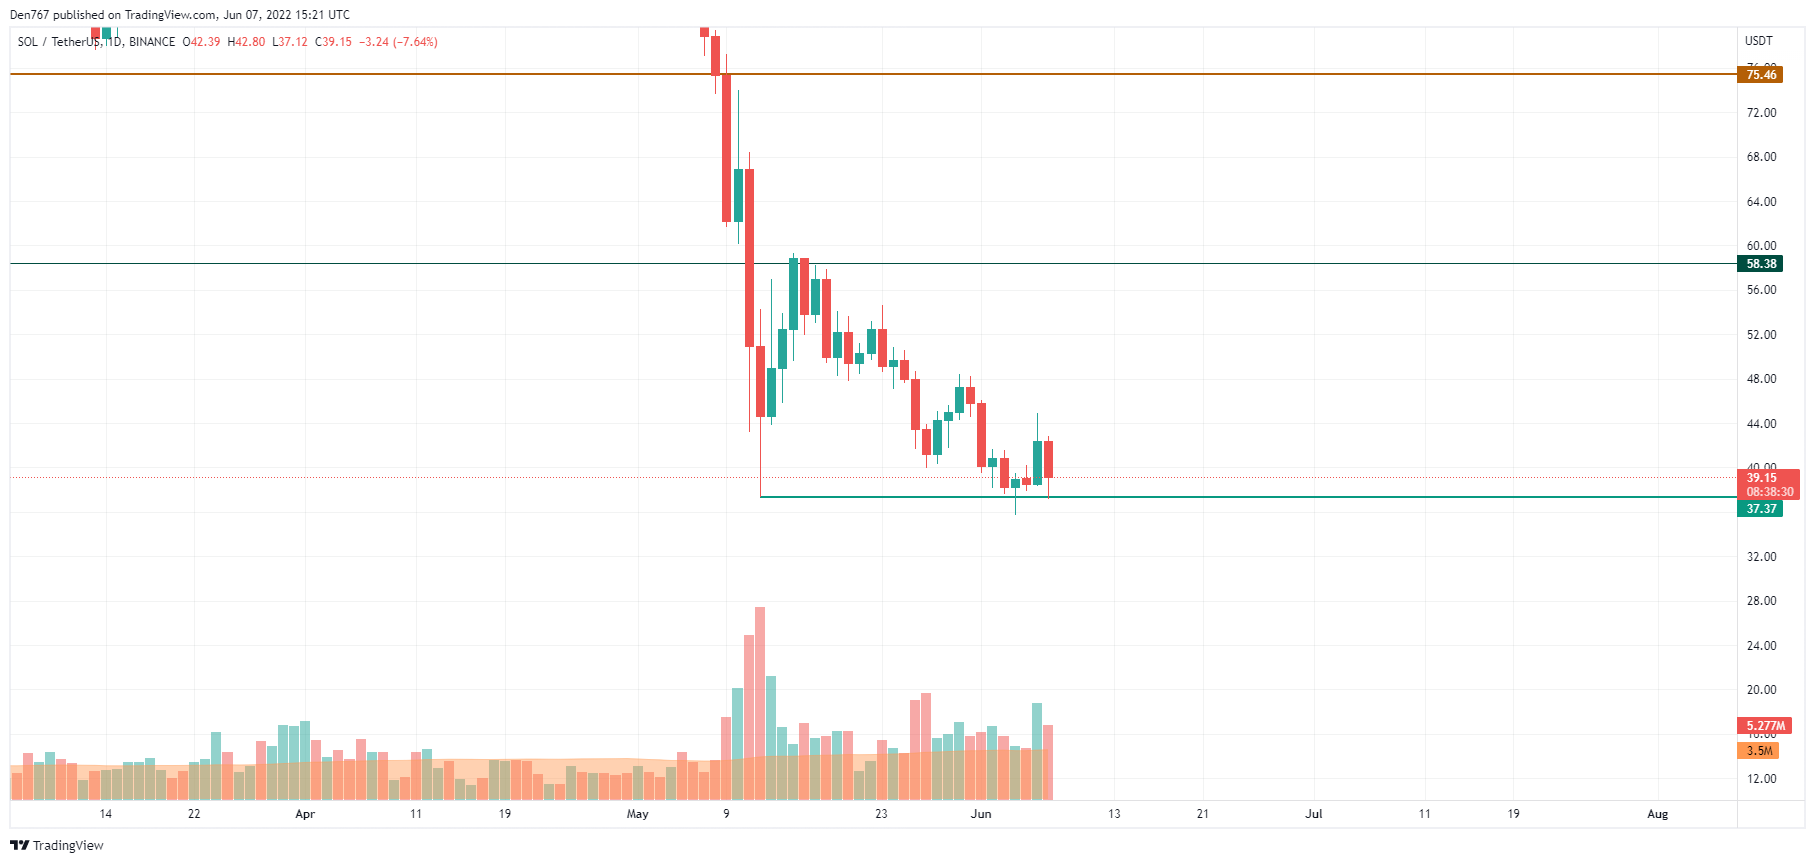
Solana (SOL) has underperformed Bitcoin (BTC), dropping by 7.62%.

Solana (SOL) is trading below its crucial level at $40 which means that a further drop is likelier than a comeback. Respectively, if buyers cannot seize the initiative and push the price back above the mentioned mark, there is a possibility of seeing the cryptocurrency testing the $35 zone soon.


